The organisation

One of the largest roadside breakdown services in Australia, considered the 'best-in-class'
—3.1 million members
—1 million + jobs per year
—$256 million revenue per year

Sole client facing, principal designer
I redesigned the entire call centre and fleet management systems for Australias largest roadside breakdown service, from the tarmac up.
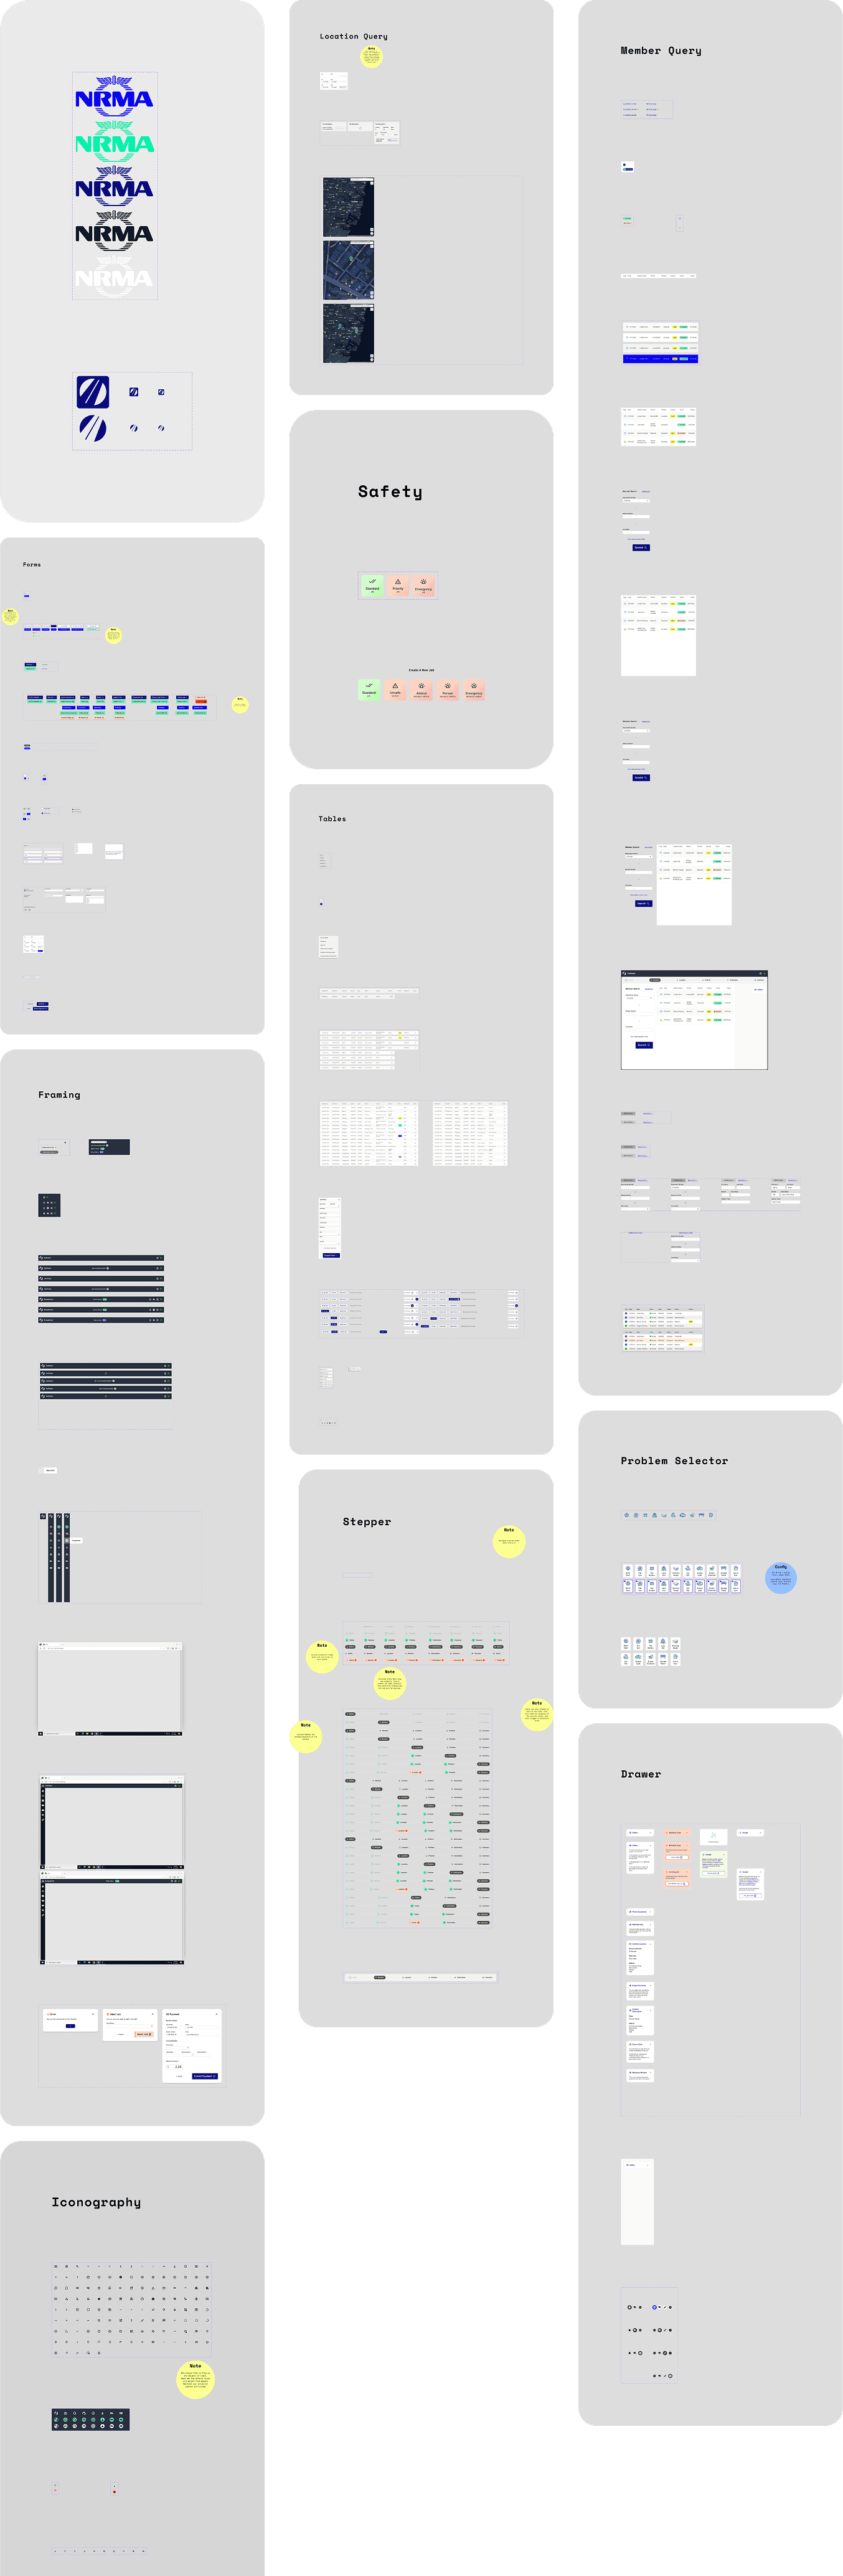
Designed —12 Micro-Personas —19 user flows/wireframes/interactive prototypes —4 Hi-fi prototypes —135 components —8 micro-animations Facilitated —14 moderated user contextual enquiries —12 initial stakeholder workshops + 10 followup sessions —5 SME discovery workshops
-165
-165
seconds per job
seconds per job
-$6.6m
-$6.6m
per year
🎯 -$2m
per year
🎯 -$2m
+18%
+18%
job completion rate
🎯 +10%
job completion rate
🎯 +10%
Scroll to explore
One of the largest roadside breakdown services in Australia, considered the 'best-in-class'
—3.1 million members
—1 million + jobs per year
—$256 million revenue per year
3.1m
active members
3000
jobs created per day
$356m
turnover per year


Breaking down on the Sydney harbour bridge, or worse still, in the outback for 4 hours under the baking hot sun, with no water, snakes, and even crocodiles.
People, when they break down in less than ideal situations, can become quite stressed out and irrational.
From an HR perspective, calltakers are typically younger people with a very high churn rate so onboarding and training is a huge repeating expense.

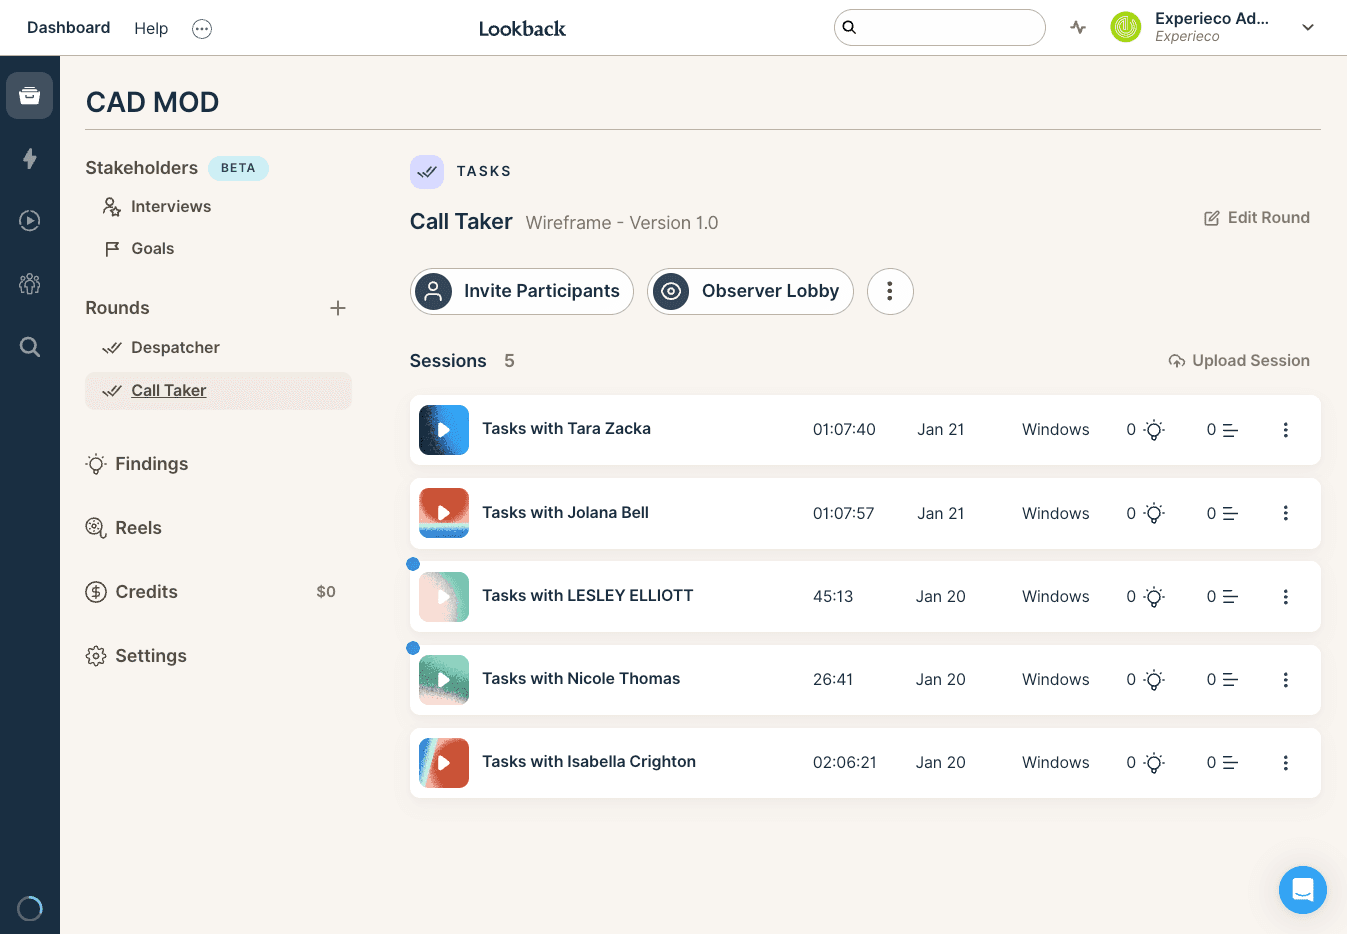
The apps:
—Calltaker - fielding calls + creating cases
—Dispatcher - assigning cases to service providers, and complex case and fleet management
Understand the end-to-end lifecycle of a job. How they are created, assigned, complete and what hurdles are encountered by all users involved.
I personally facilitated:
—14 moderated user contextual enquiries
—12 initial stakeholder workshops + 10 followup sessions
—5 SME discovery workshops
—8 Information Immersion 🧽 workshops
—Synthesised findings
—Mapped 73 flows to match current system features

20 year old systems
Frankenstein design with workarounds-as-core-process
Trust gap with system data
Business rules creating friction
Country complexity magnifier
Notification overload & mis-prioritisation
Expensive onboarding with 62 page scripting guide
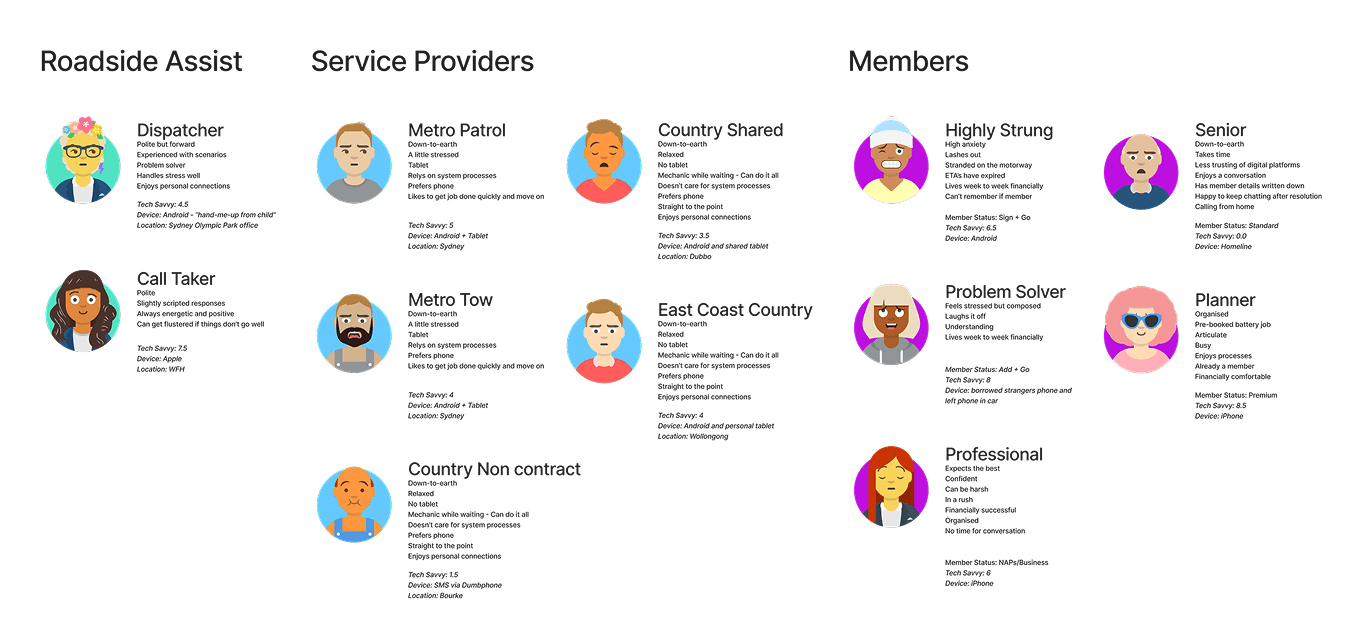
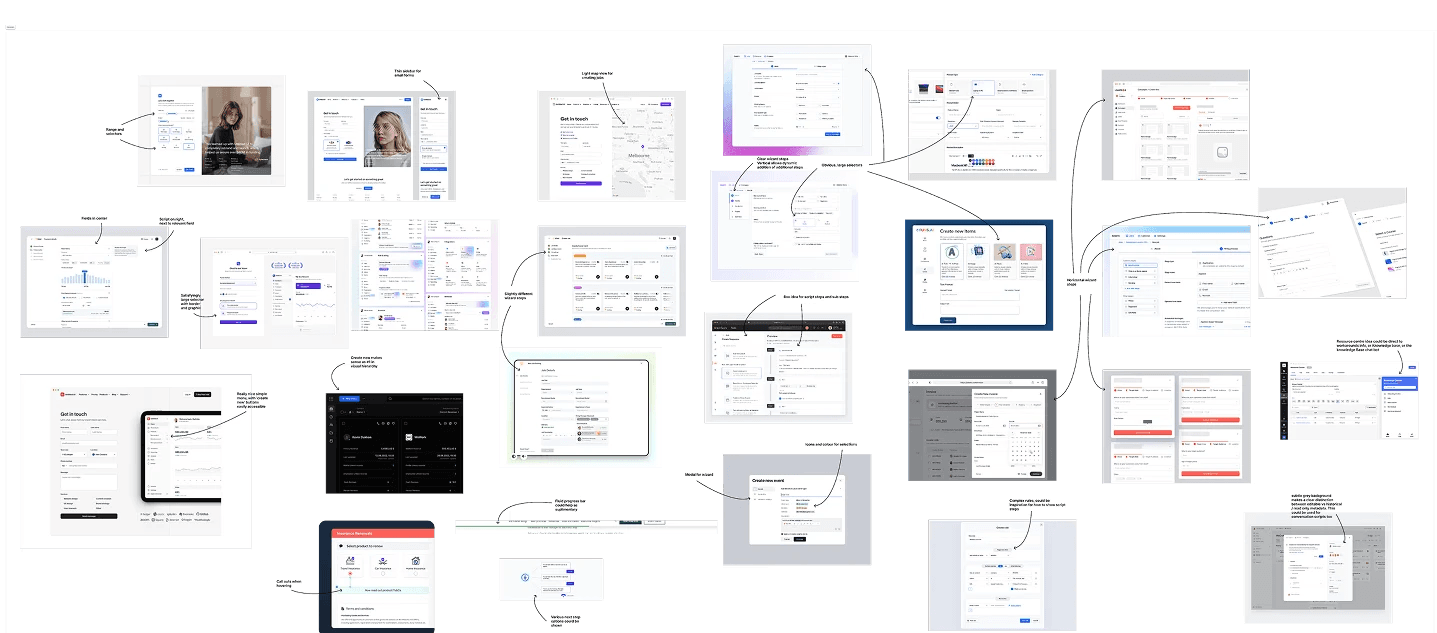
Image Aspect Ratio
Set up the component by adding image to the component properties.
Image Aspect Ratio
Set up the component by adding image to the component properties.
Image Aspect Ratio
Set up the component by adding image to the component properties.
Image Aspect Ratio
Set up the component by adding image to the component properties.


—20 co-creation sessions with various super users/SMEs/Stakeholders
—6 technical review sessions
—5 design demo presentations
—21 user testing sessions over 2 iterations
—Qualitative data analysis: before and after fleet travel time per job
The MVP release which only included the eco-system and minor features, has already reduced service provider travel time by 165 seconds per job
With 30,000 jobs per month that equates to around $6.6m per year, well beyond the cost saving goal of $2m
The other executive defined goal for the programme of work was to increase the Job completion rate from 72% up to 80%. This has moved up to just over 90% since release
Stay tuned for more updates as the applications are in the build phase
-165
seconds per job
-$6.6m
per year
🎯 -$2m
+18%
job completion rate
🎯 +10%
End-to-end happy path flow demo to illustrate main features of the Calltaker app
End-to-end happy path flow demo to illustrate main features of the Calltaker app
Demo displaying the AI recommendation feature
Demo displaying the AI recommendation feature
Demo of the two main screens for the Dispatcher app AI insights feature
Demo of the two main screens for the Dispatcher app AI insights feature
Get in touch
Let me know if you would like to have a chat
" height="64px" id="mYbwgWRYx" width="64px"/></svg>)
" height="64px" id="LVarXRgD6" width="64px"/></svg>)
